
Menu engineering sorts every dish into four categories by profit per plate and popularity: Stars (high profit, high sales), Plowhorses (low profit, high sales), Puzzles (high profit, low sales), and Dogs (low profit, low sales). The strategy then writes itself — protect Stars, re-cost and reprice Plowhorses, market the Puzzles, and remove the Dogs. Done once a quarter with your real sales data, it routinely lifts restaurant profit by 5–10% without adding a single customer.
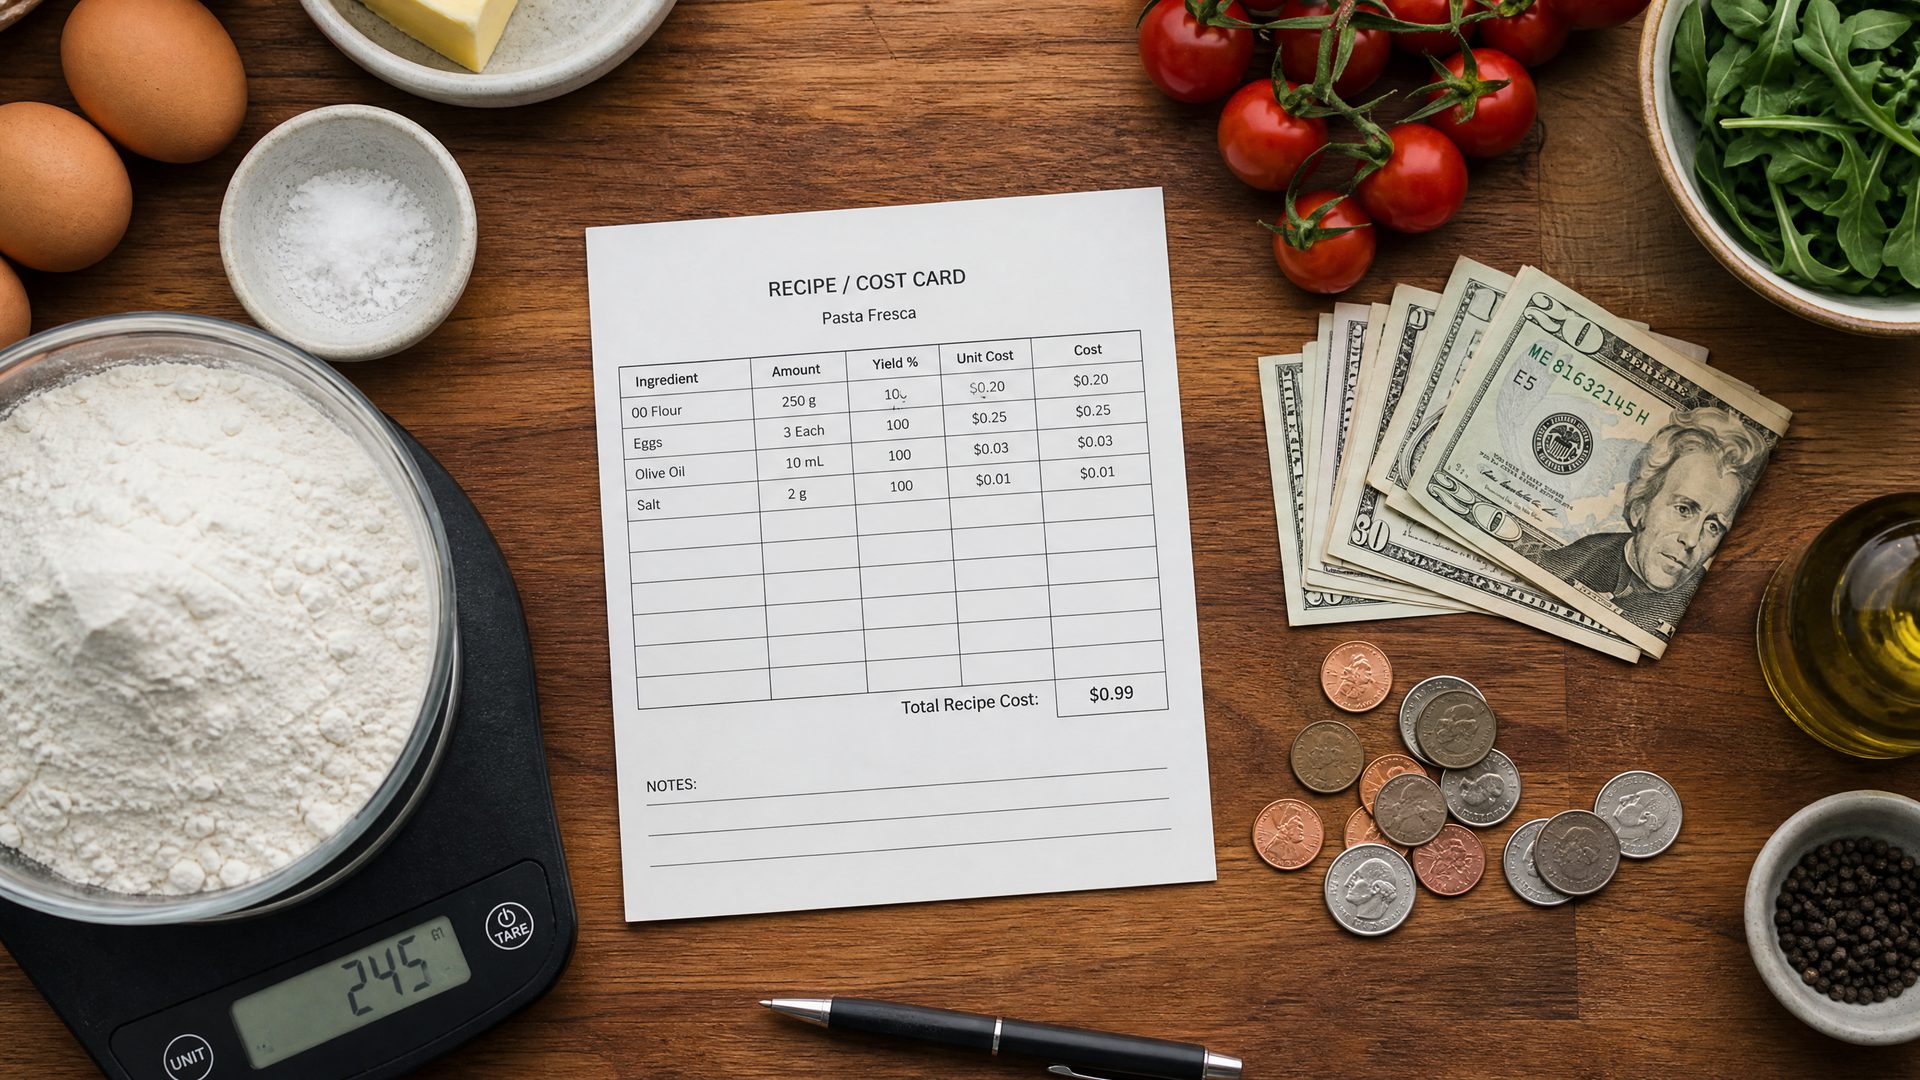
First, compute each dish's contribution margin: selling price minus food cost. Then split your menu at the median for margin and the median for sales volume.
| Category | Profit | Popularity | Action |
|---|---|---|---|
| Star | High | High | Protect: never discount, keep quality locked |
| Plowhorse | Low | High | Re-cost, reprice, or re-portion |
| Puzzle | High | Low | Market harder, rename, replate, or relocate on the menu |
| Dog | Low | Low | Remove or rebuild from scratch |
The insight that surprises most owners: your bestseller is often not your best dish. The grilled chicken everyone orders may be earning $1.10 a plate while the fish you barely sell earns $6.40 — a Puzzle waiting to be marketed.
Worked example: a Nairobi café sells 1,200 plates of its chicken wrap monthly at $4.50 with a $2.70 cost — $2,160/month margin, a Plowhorse. Repricing to $4.90 (still competitive) adds $480/month with zero marketing, because the customers were already buying.
Menu design research shows consistent effects: dishes in the top-right of a page sell more; removing currency symbols slightly raises spend; placing a clearly profitable dish in the 'eye magnet' position (first item after the heading) lifts its sales; and naming matters — 'Grandmother's slow-roasted beef' outsells 'beef stew' at the same price. None of this costs anything; it is positioning.
A menu is not a menu engineering exercise once; it is one per quarter. Prices change, seasons change, and dishes migrate between quadrants as customers find them. Owners who repeat the cycle keep margins protected automatically — the same cadence that RestoIQ supports by keeping recipe costs and sales data current in one place, so the quadrant analysis is a five-minute job instead of a weekend spreadsheet project.
Stars (high profit, popular), Plowhorses (low profit, popular), Puzzles (high profit, unpopular), and Dogs (low profit, unpopular). Each has a different action: protect, reprice, market, or remove.
Plowhorses — high-selling dishes with thin margins. Customers already love them, so a small price increase flows directly to profit with minimal sales risk.
Quarterly. Supplier prices, seasons, and customer tastes all shift; the quadrant positions you assigned in January will not hold through the year.