
Food cost percentage is your food and beverage costs divided by your food and beverage sales, expressed as a percentage. Healthy full-service restaurants run 28–32%; cafés and bars 25–30%. If yours is above 35%, the money is leaking through four channels: inaccurate menu pricing, portion drift, waste and spoilage, and supplier price creep. This guide shows how to calculate it properly (weekly, not monthly), diagnose which channel is leaking, and bring the number down within a month.
The monthly version everyone quotes:
Food cost % = (opening stock + purchases − closing stock) ÷ food sales × 100.
Example: a restaurant opens the month with $4,200 of stock, buys $12,800 from suppliers, closes at $3,900, and sells $52,000 of food. Food used = 4,200 + 12,800 − 3,900 = $13,100. Food cost % = 13,100 ÷ 52,000 = 25.2% — an excellent number.
Now the honest version: a monthly number hides four bad weeks inside one average. A weekly number tells you which week went wrong — the delivery week, the holiday week, the week a new cook joined. Count weekly; the formula is the same, just shorter.
| Business type | Healthy range | Warning above |
|---|---|---|
| Full-service restaurant | 28–32% | 35% |
| Café | 25–30% | 33% |
| Bar | 20–28% | 30% |
| Fast food / takeaway | 28–33% | 35% |
| Hotel restaurant | 30–34% | 37% |
Bars and cafés run tighter because drinks, coffee, and pastries carry much better margins than protein-heavy plated dishes. Fine dining tolerates slightly higher food cost because guests pay for experience, not calories.
1. Menu pricing. Cost every dish: ingredients × current prices. If a dish costs $4.20 to make and sells for $11, its food cost is 38% — priced wrong at the source. Reprice or rebuild.
2. Portion drift. The recipe says 180g; the kitchen serves 230g. The burger's food cost quietly jumps from 30% to 38% and no invoice shows it. Weigh portions occasionally.
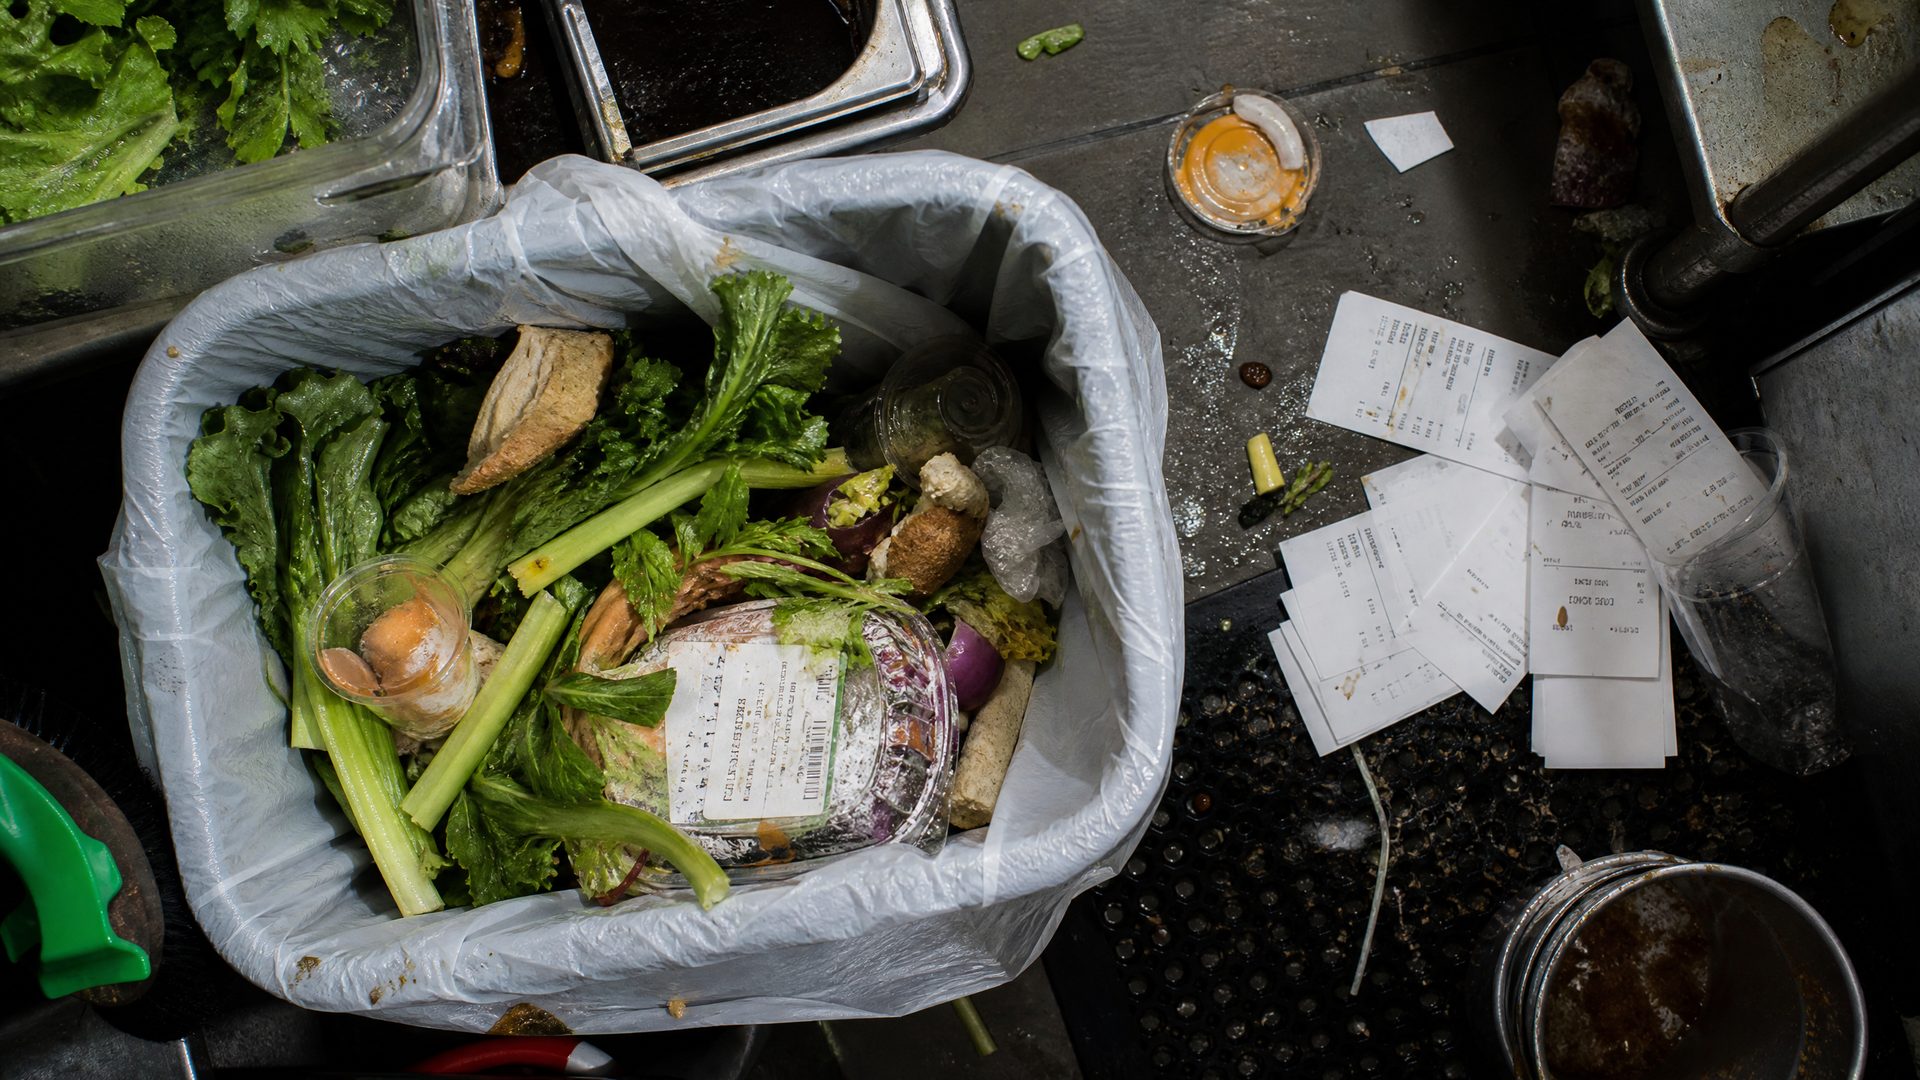
3. Waste and spoilage. Everything thrown away is a cost with no sale. Log it; most owners discover 3–6% of purchases end up in the bin unmeasured.
4. Supplier price creep. The oil supplier's price rose 4% three invoices ago and no one noticed. Track prices per supplier, per item — this alone is worth thousands a year.
None of this requires an MBA. It requires a routine — which is what RestoIQ was built to make almost automatic: counts, recipes, purchase orders, and waste logs feeding one dashboard with your food cost number front and centre.
A restaurant in Kampala doing $18,000/month was running ~37% food cost and could not see why. The weekly diagnosis: chicken (38% food-cost dishes on the menu), oil creeping up 6% over four invoices, and ~$400/month of unmeasured produce spoilage. Nine weeks after repricing two dishes, renegotiating the oil contract with a competing quote, and starting waste logs, food cost sat at 31.5% — roughly $990/month back in the owner's pocket, every month, permanently.
28–32% for full-service restaurants, 25–30% for cafés, 20–28% for bars. Anything consistently above 35% for a standard restaurant means money is leaking somewhere.
(Opening stock + purchases − closing stock) ÷ food sales × 100. Calculate weekly rather than monthly so you can see which week the leak started.
Almost always one of four causes: menu prices set below cost targets, portion sizes drifting up, unmeasured waste, or supplier prices creeping up between invoices.